
Skip to content
Download the PDF

Tools

The book’s six figures

Every figure from The Lost Art of the Plan, rebuilt as accessible web graphics with the book’s own captions and source lines, a text equivalent for each, and downloads. The same figures stand on the Tools page, where the work is.

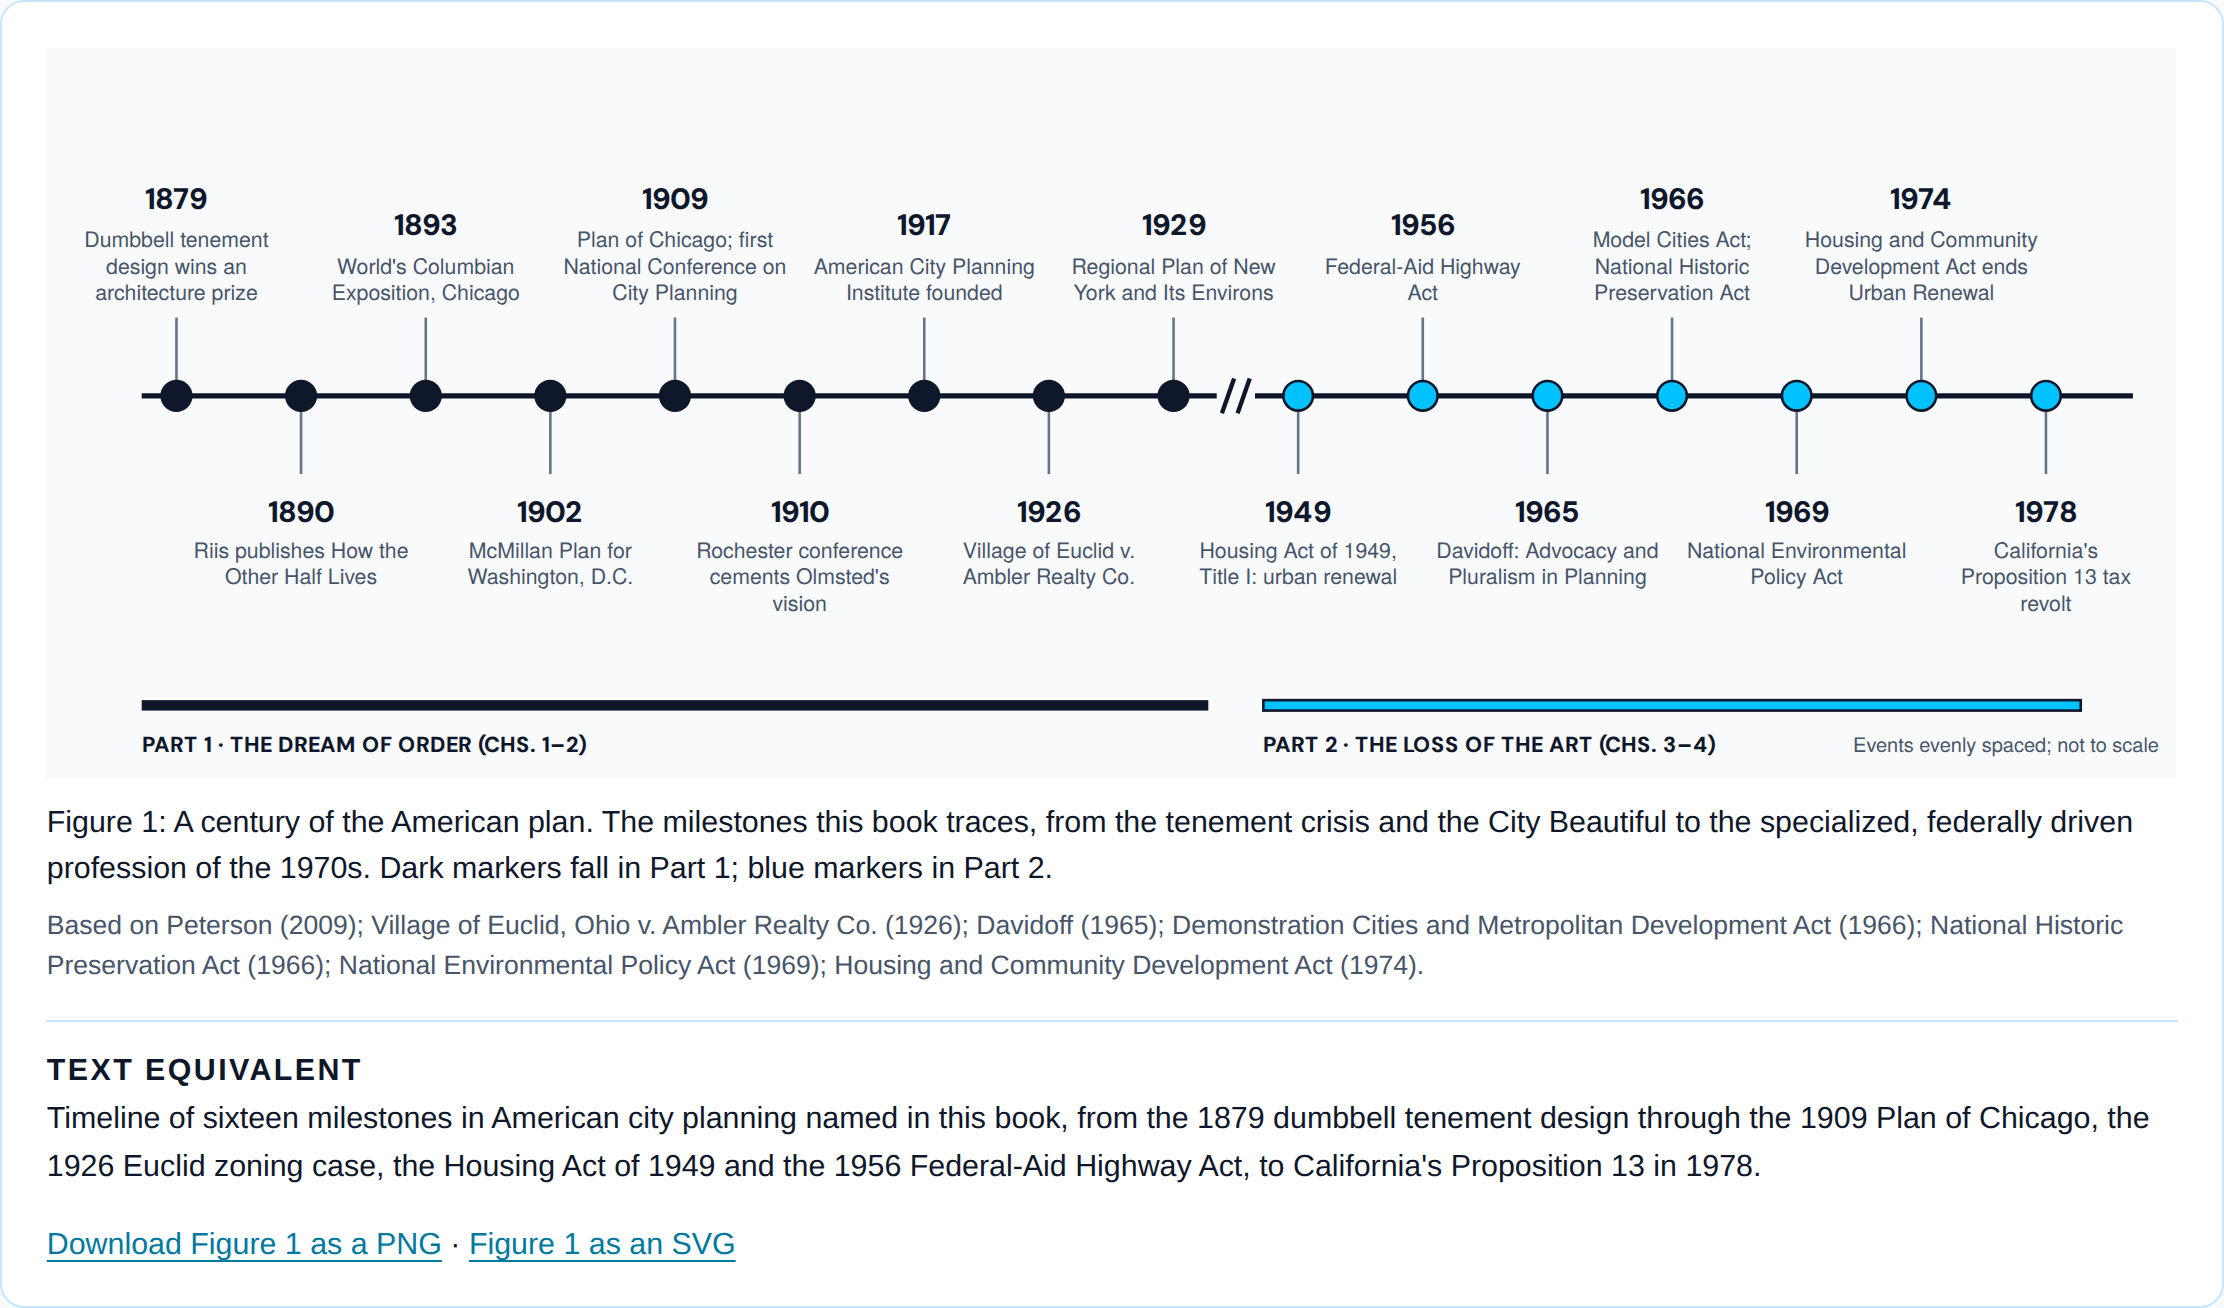
A century of the American plan, 1879–1978Timeline of sixteen milestones in American city planning named in this book, from the 1879 dumbbell tenement design through the 1909 Plan of Chicago, the 1926 Euclid zoning case, the Housing Act of 1949 and the 1956 Federal-Aid Highway Act, to California's Proposition 13 in 1978.1879Dumbbell tenementdesign wins anarchitecture prize1890Riis publishes How theOther Half Lives1893World's ColumbianExposition, Chicago1902McMillan Plan forWashington, D.C.1909Plan of Chicago; firstNational Conference onCity Planning1910Rochester conferencecements Olmsted'svision1917American City PlanningInstitute founded1926Village of Euclid v.Ambler Realty Co.1929Regional Plan of NewYork and Its Environs1949Housing Act of 1949,Title I: urban renewal1956Federal-Aid HighwayAct1965Davidoff: Advocacy andPluralism in Planning1966Model Cities Act;National HistoricPreservation Act1969National EnvironmentalPolicy Act1974Housing and CommunityDevelopment Act endsUrban Renewal1978California'sProposition 13 taxrevoltPART 1 · THE DREAM OF ORDER (CHS. 1–2)PART 2 · THE LOSS OF THE ART (CHS. 3–4)Events evenly spaced; not to scale
Figure 1: A century of the American plan. The milestones this book traces, from the tenement crisis and the City Beautiful to the specialized, federally driven profession of the 1970s. Dark markers fall in Part 1; blue markers in Part 2.

Based on Peterson (2009); Village of Euclid, Ohio v. Ambler Realty Co. (1926); Davidoff (1965); Demonstration Cities and Metropolitan Development Act (1966); National Historic Preservation Act (1966); National Environmental Policy Act (1969); Housing and Community Development Act (1974).

Text equivalent

Timeline of sixteen milestones in American city planning named in this book, from the 1879 dumbbell tenement design through the 1909 Plan of Chicago, the 1926 Euclid zoning case, the Housing Act of 1949 and the 1956 Federal-Aid Highway Act, to California's Proposition 13 in 1978.
Download Figure 1 as a PNG · Figure 1 as an SVG

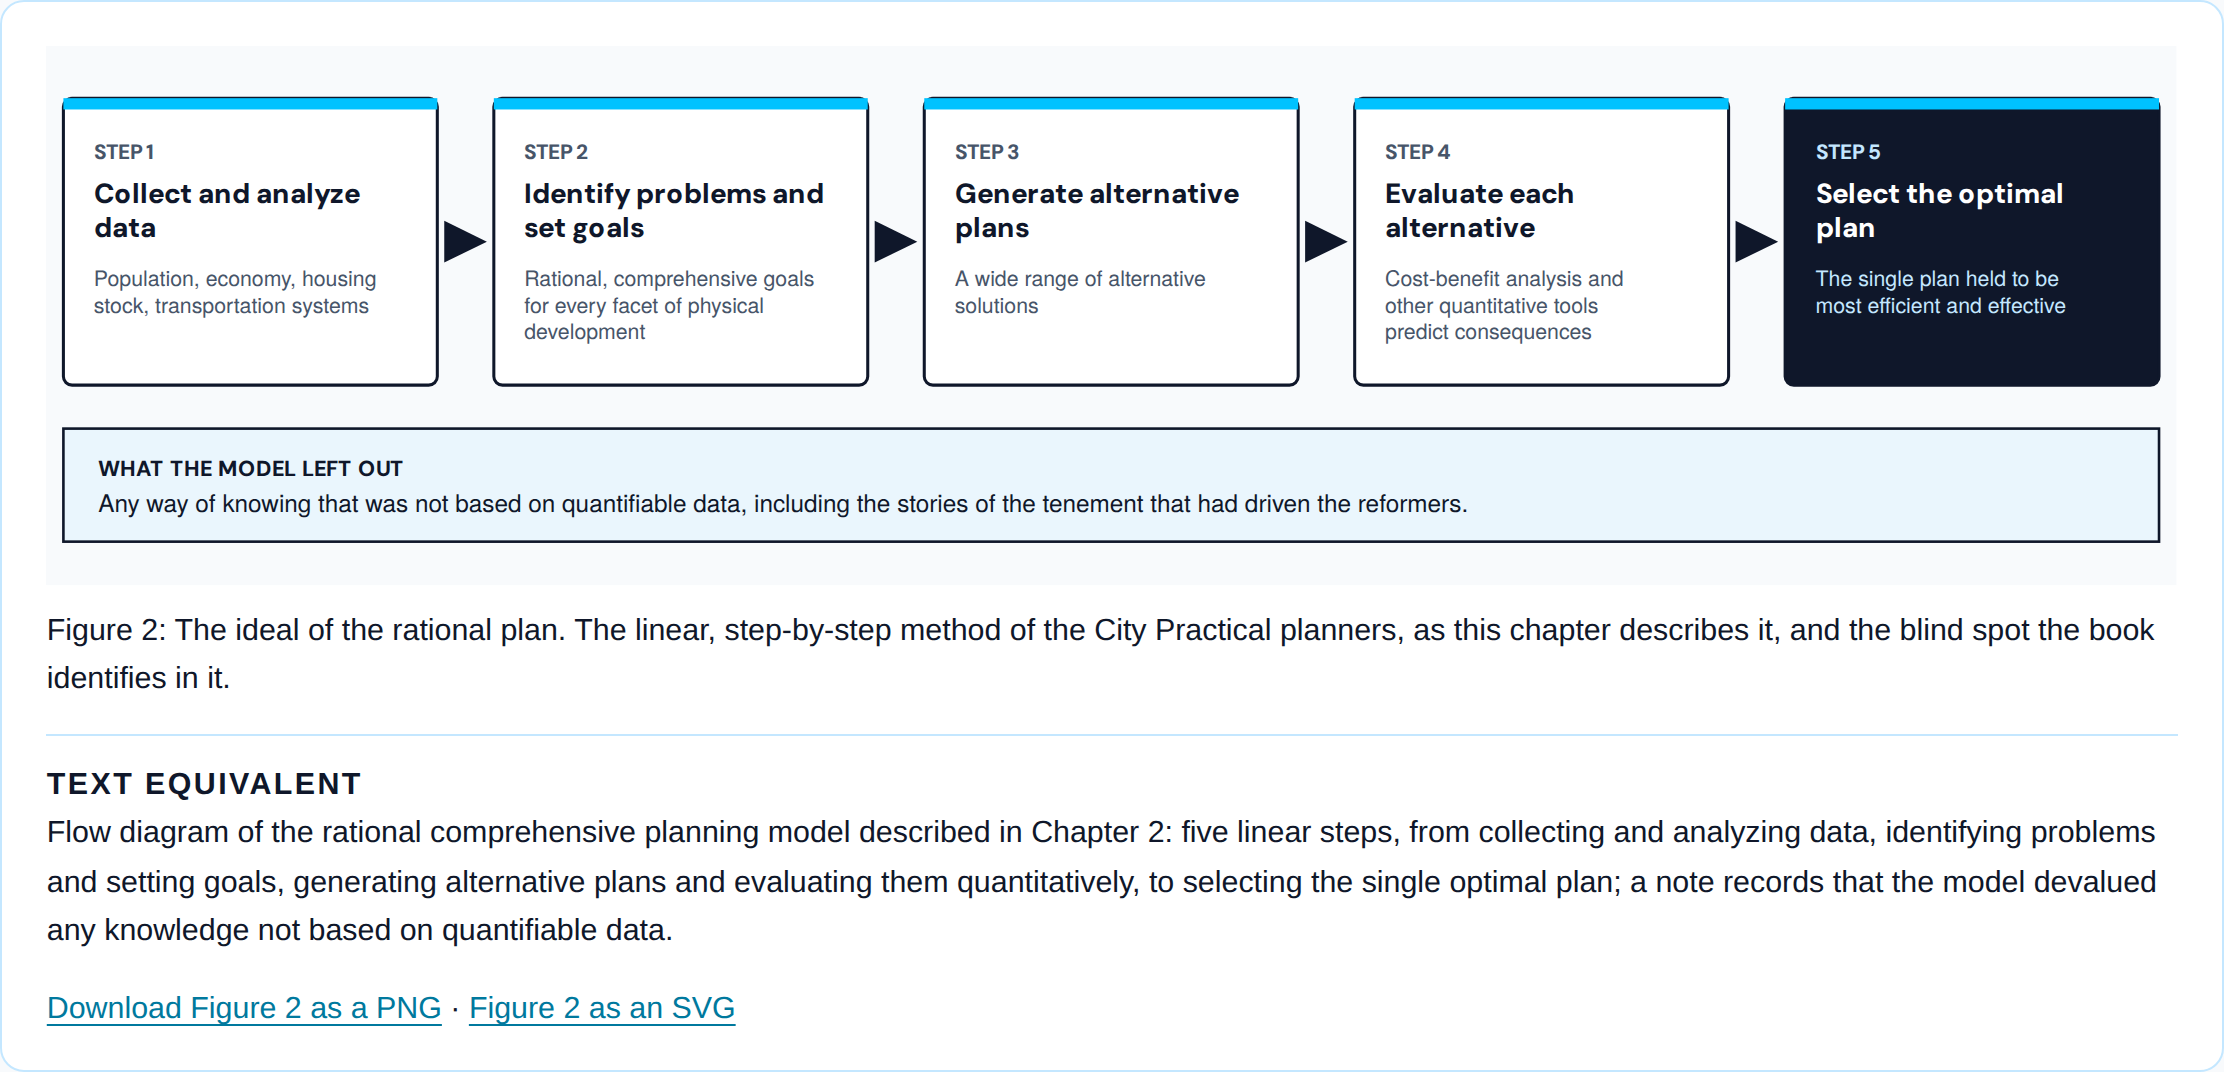
The rational comprehensive planning modelFlow diagram of the rational comprehensive planning model described in Chapter 2: five linear steps, from collecting and analyzing data, identifying problems and setting goals, generating alternative plans and evaluating them quantitatively, to selecting the single optimal plan; a note records that the model devalued any knowledge not based on quantifiable data.STEP 1Collect and analyzedataPopulation, economy, housingstock, transportation systemsSTEP 2Identify problems andset goalsRational, comprehensive goalsfor every facet of physicaldevelopmentSTEP 3Generate alternativeplansA wide range of alternativesolutionsSTEP 4Evaluate eachalternativeCost-benefit analysis andother quantitative toolspredict consequencesSTEP 5Select the optimalplanThe single plan held to bemost efficient and effectiveWHAT THE MODEL LEFT OUTAny way of knowing that was not based on quantifiable data, including the stories of the tenement that had driven the reformers.
Figure 2: The ideal of the rational plan. The linear, step-by-step method of the City Practical planners, as this chapter describes it, and the blind spot the book identifies in it.

Text equivalent

Flow diagram of the rational comprehensive planning model described in Chapter 2: five linear steps, from collecting and analyzing data, identifying problems and setting goals, generating alternative plans and evaluating them quantitatively, to selecting the single optimal plan; a note records that the model devalued any knowledge not based on quantifiable data.
Download Figure 2 as a PNG · Figure 2 as an SVG

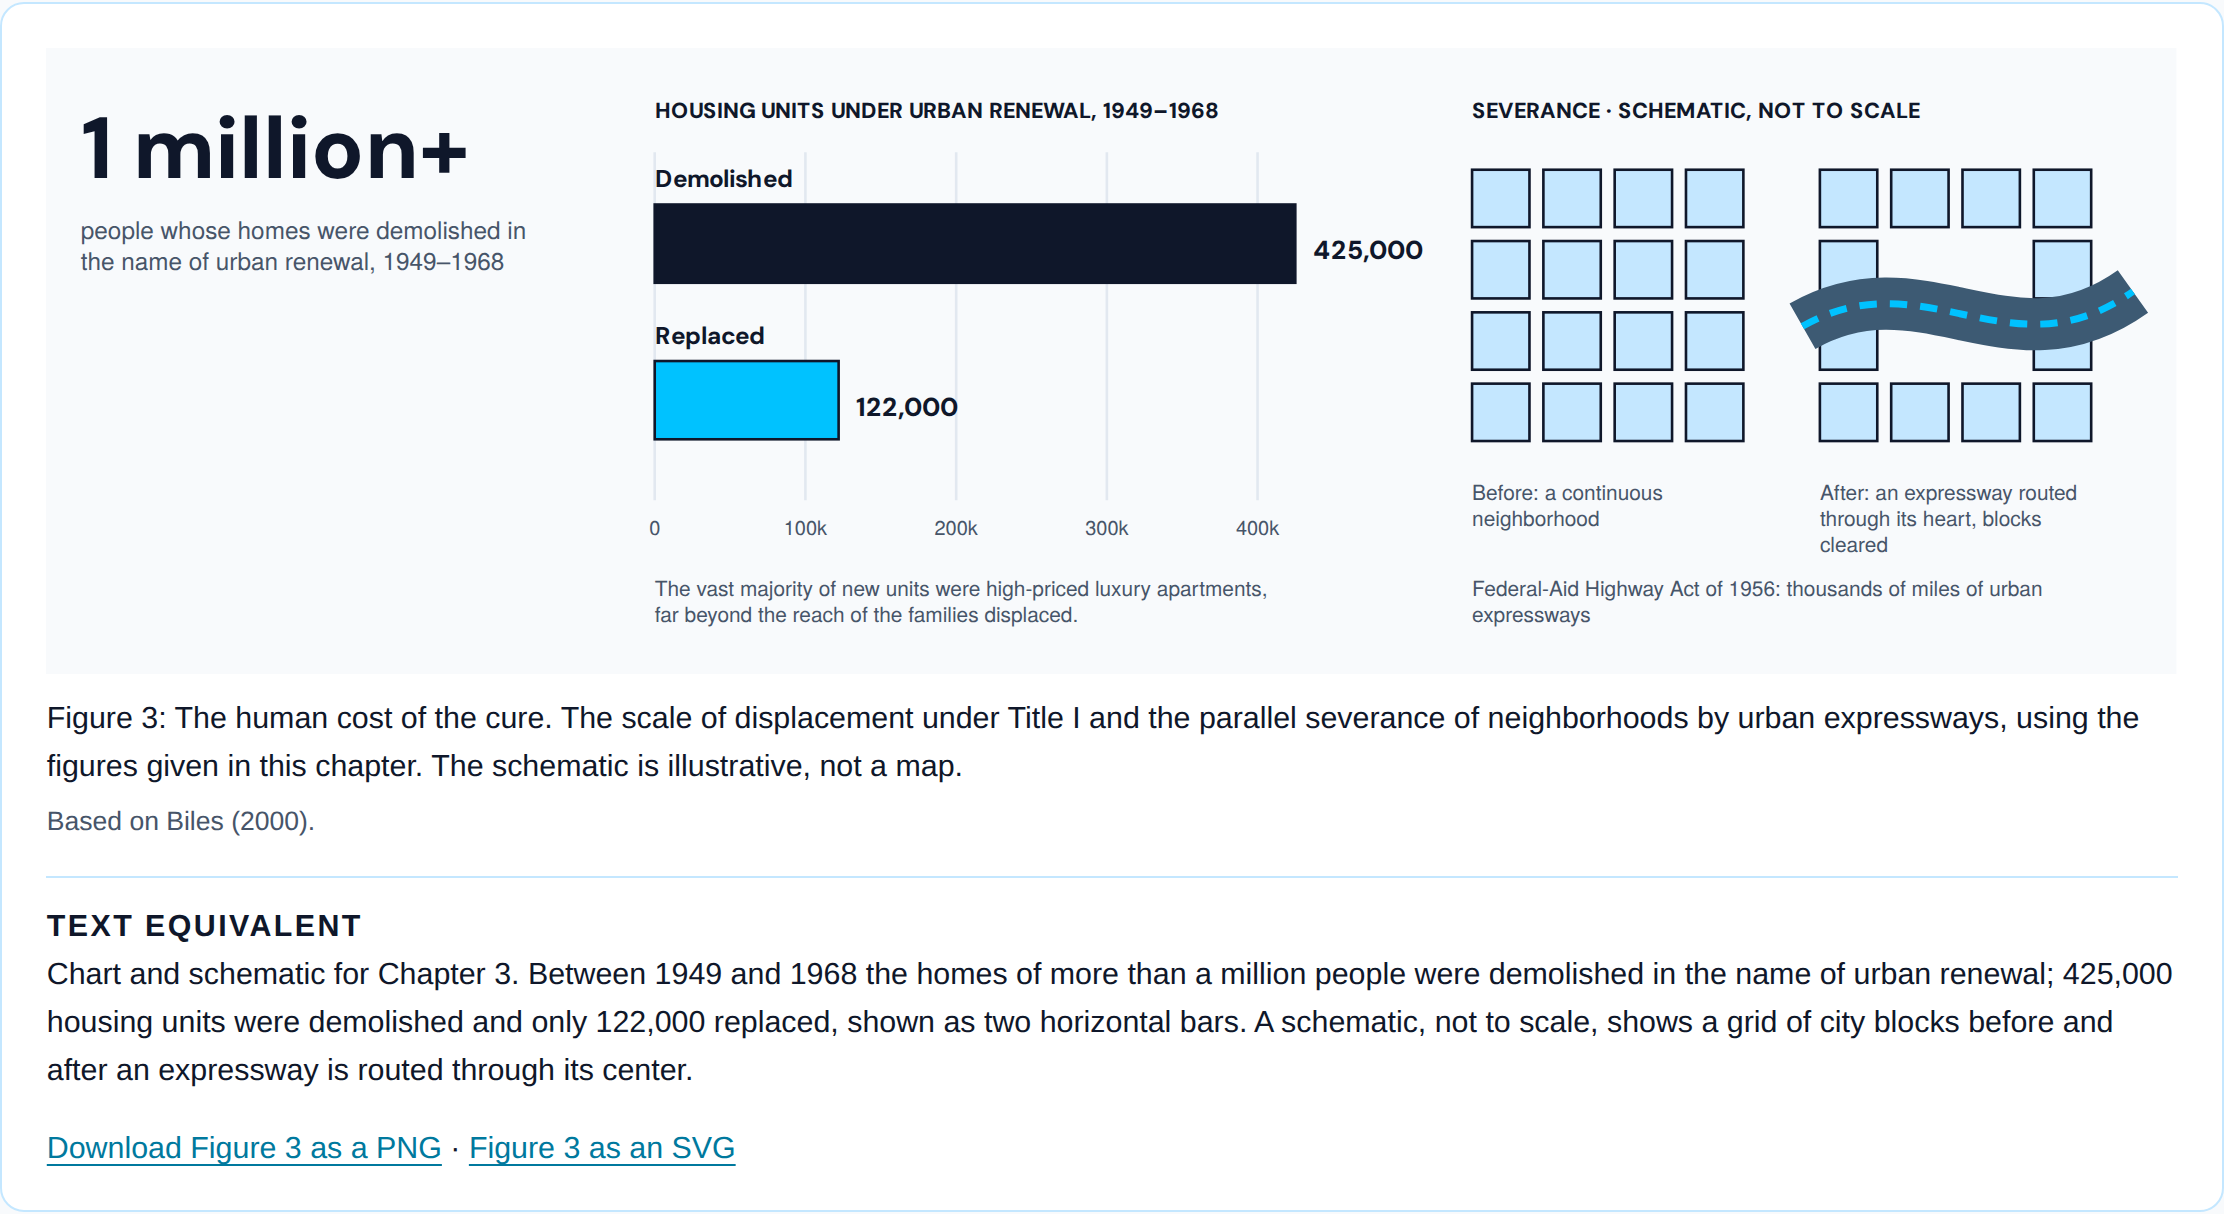
Urban renewal by the numbers, 1949–1968Chart and schematic for Chapter 3. Between 1949 and 1968 the homes of more than a million people were demolished in the name of urban renewal; 425,000 housing units were demolished and only 122,000 replaced, shown as two horizontal bars. A schematic, not to scale, shows a grid of city blocks before and after an expressway is routed through its center.1 million+people whose homes were demolished inthe name of urban renewal, 1949–1968HOUSING UNITS UNDER URBAN RENEWAL, 1949–19680100k200k300k400kDemolished425,000Replaced122,000The vast majority of new units were high-priced luxury apartments,far beyond the reach of the families displaced.SEVERANCE · SCHEMATIC, NOT TO SCALEBefore: a continuousneighborhoodAfter: an expressway routedthrough its heart, blocksclearedFederal-Aid Highway Act of 1956: thousands of miles of urbanexpressways
Figure 3: The human cost of the cure. The scale of displacement under Title I and the parallel severance of neighborhoods by urban expressways, using the figures given in this chapter. The schematic is illustrative, not a map.

Based on Biles (2000).

Text equivalent

Chart and schematic for Chapter 3. Between 1949 and 1968 the homes of more than a million people were demolished in the name of urban renewal; 425,000 housing units were demolished and only 122,000 replaced, shown as two horizontal bars. A schematic, not to scale, shows a grid of city blocks before and after an expressway is routed through its center.
Download Figure 3 as a PNG · Figure 3 as an SVG

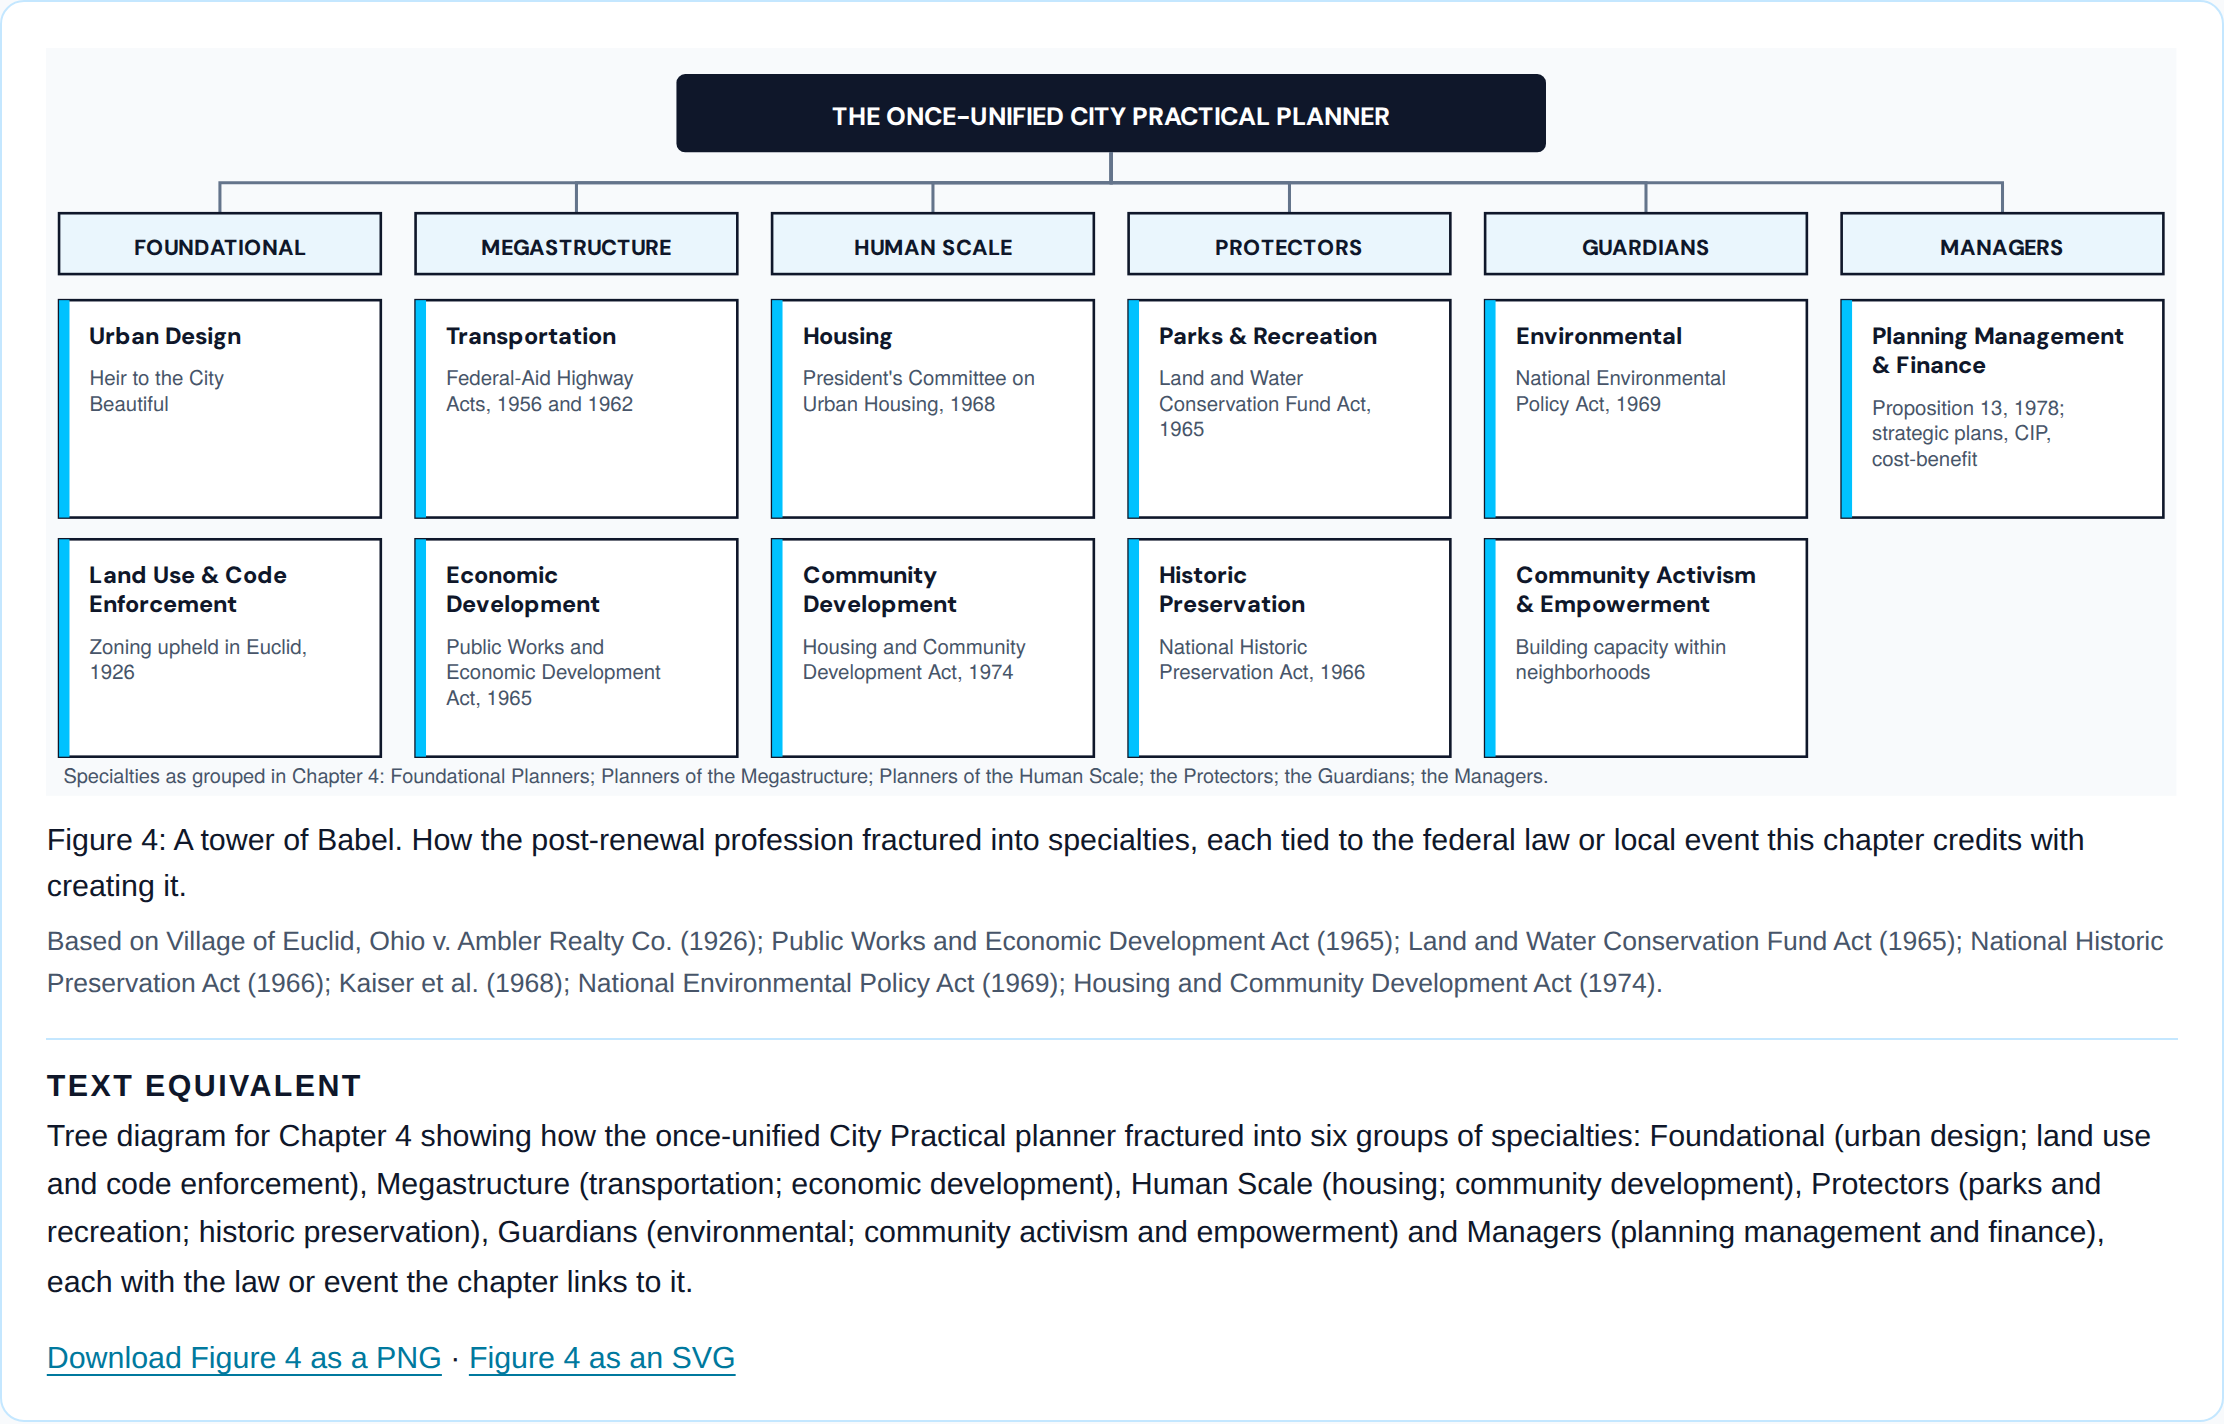
The fracturing of the planning professionTree diagram for Chapter 4 showing how the once-unified City Practical planner fractured into six groups of specialties: Foundational (urban design; land use and code enforcement), Megastructure (transportation; economic development), Human Scale (housing; community development), Protectors (parks and recreation; historic preservation), Guardians (environmental; community activism and empowerment) and Managers (planning management and finance), each with the law or event the chapter links to it.THE ONCE-UNIFIED CITY PRACTICAL PLANNERFOUNDATIONALUrban DesignHeir to the CityBeautifulLand Use & CodeEnforcementZoning upheld in Euclid,1926MEGASTRUCTURETransportationFederal-Aid HighwayActs, 1956 and 1962EconomicDevelopmentPublic Works andEconomic DevelopmentAct, 1965HUMAN SCALEHousingPresident's Committee onUrban Housing, 1968CommunityDevelopmentHousing and CommunityDevelopment Act, 1974PROTECTORSParks & RecreationLand and WaterConservation Fund Act,1965HistoricPreservationNational HistoricPreservation Act, 1966GUARDIANSEnvironmentalNational EnvironmentalPolicy Act, 1969Community Activism& EmpowermentBuilding capacity withinneighborhoodsMANAGERSPlanning Management& FinanceProposition 13, 1978;strategic plans, CIP,cost-benefitSpecialties as grouped in Chapter 4: Foundational Planners; Planners of the Megastructure; Planners of the Human Scale; the Protectors; the Guardians; the Managers.
Figure 4: A tower of Babel. How the post-renewal profession fractured into specialties, each tied to the federal law or local event this chapter credits with creating it.

Based on Village of Euclid, Ohio v. Ambler Realty Co. (1926); Public Works and Economic Development Act (1965); Land and Water Conservation Fund Act (1965); National Historic Preservation Act (1966); Kaiser et al. (1968); National Environmental Policy Act (1969); Housing and Community Development Act (1974).

Text equivalent

Tree diagram for Chapter 4 showing how the once-unified City Practical planner fractured into six groups of specialties: Foundational (urban design; land use and code enforcement), Megastructure (transportation; economic development), Human Scale (housing; community development), Protectors (parks and recreation; historic preservation), Guardians (environmental; community activism and empowerment) and Managers (planning management and finance), each with the law or event the chapter links to it.
Download Figure 4 as a PNG · Figure 4 as an SVG

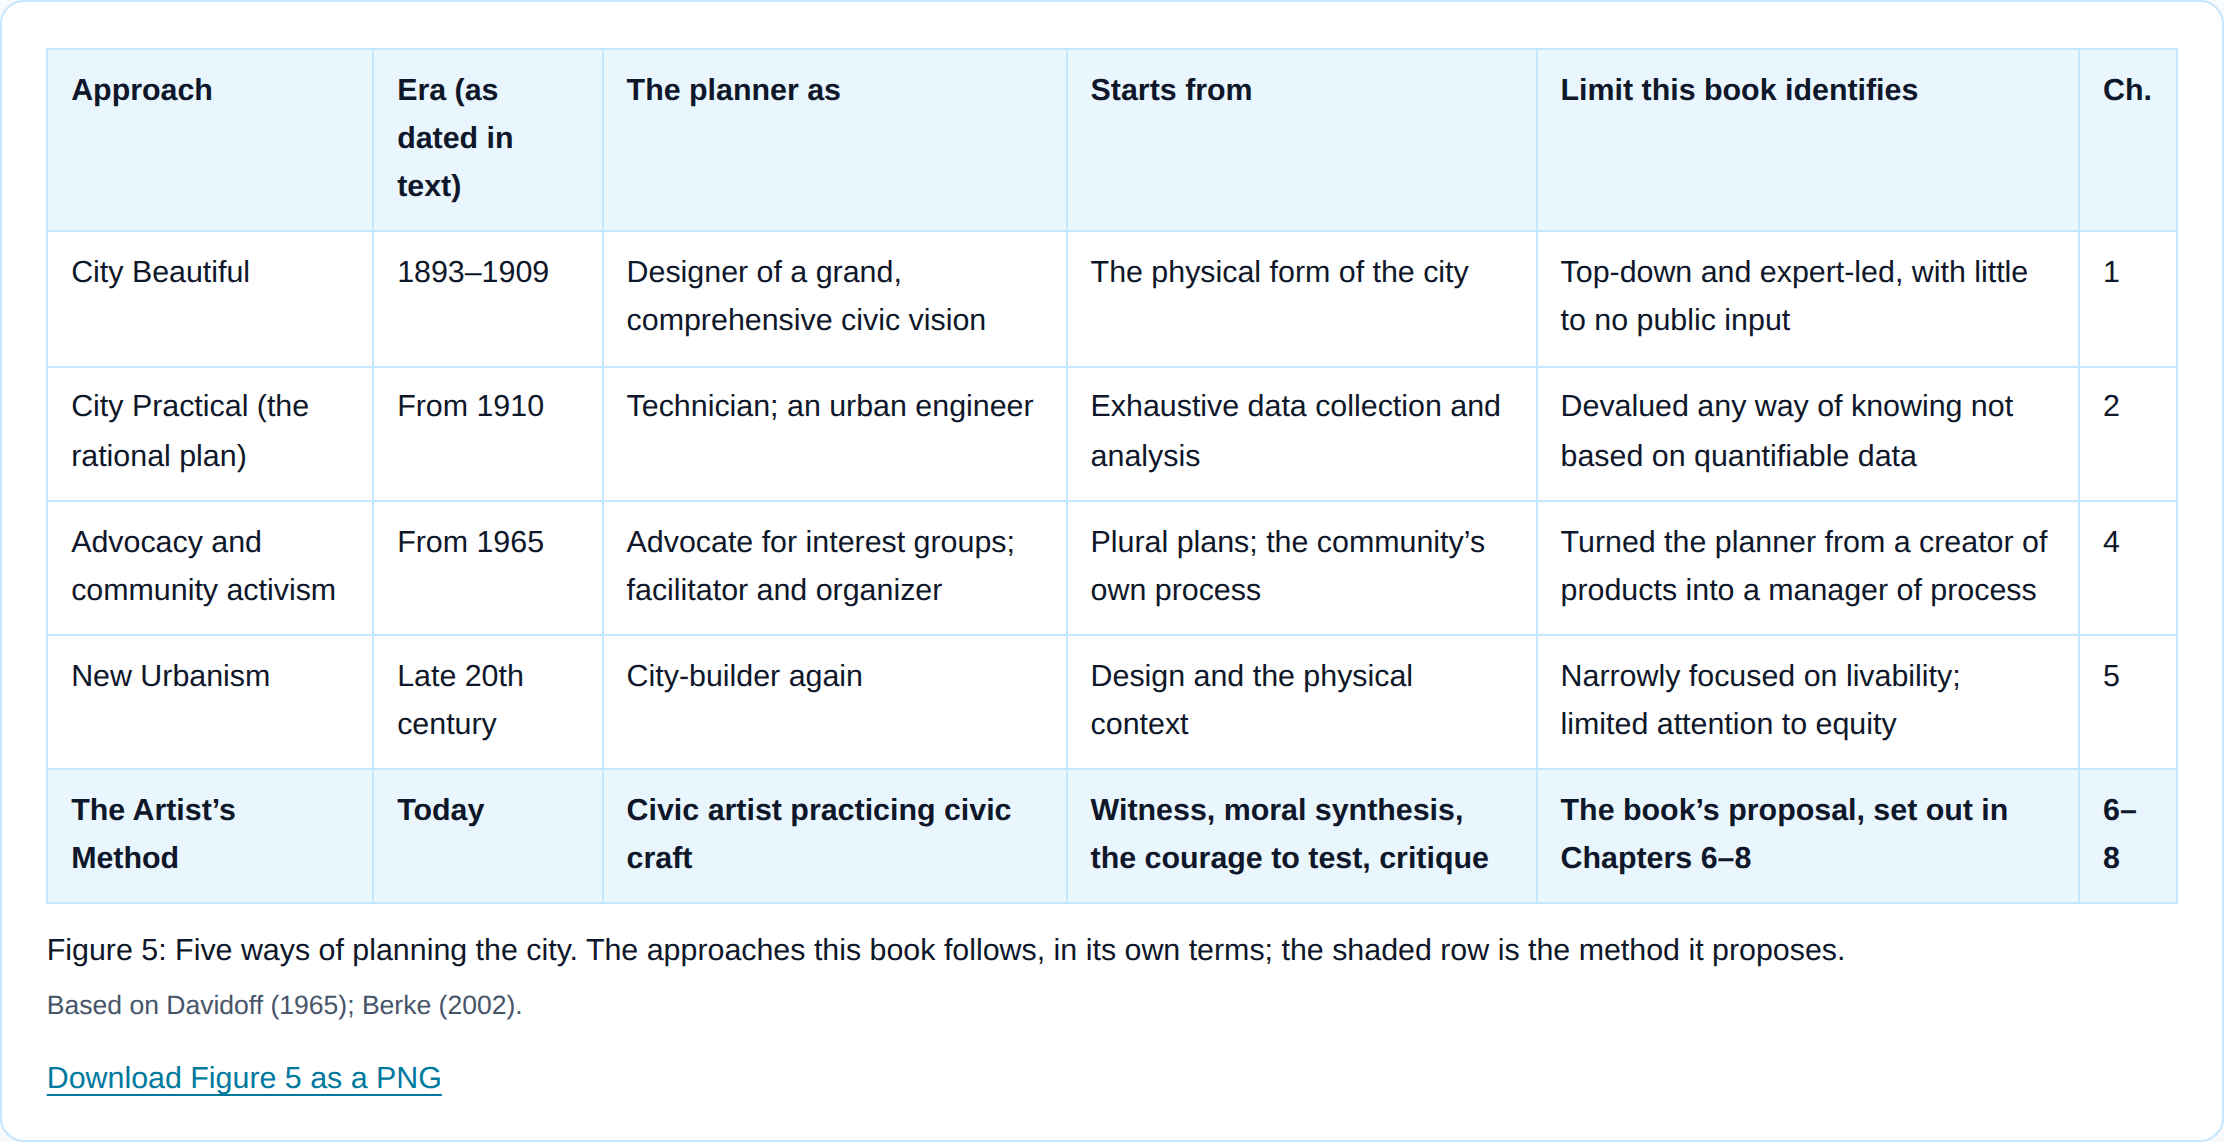
ApproachEra (as dated in text)The planner asStarts fromLimit this book identifiesCh.
City Beautiful1893–1909Designer of a grand, comprehensive civic visionThe physical form of the cityTop-down and expert-led, with little to no public input1
City Practical (the rational plan)From 1910Technician; an urban engineerExhaustive data collection and analysisDevalued any way of knowing not based on quantifiable data2
Advocacy and community activismFrom 1965Advocate for interest groups; facilitator and organizerPlural plans; the community’s own processTurned the planner from a creator of products into a manager of process4
New UrbanismLate 20th centuryCity-builder againDesign and the physical contextNarrowly focused on livability; limited attention to equity5
The Artist’s MethodTodayCivic artist practicing civic craftWitness, moral synthesis, the courage to test, critiqueThe book’s proposal, set out in Chapters 6–86–8
Figure 5: Five ways of planning the city. The approaches this book follows, in its own terms; the shaded row is the method it proposes.

Based on Davidoff (1965); Berke (2002).
Download Figure 5 as a PNG

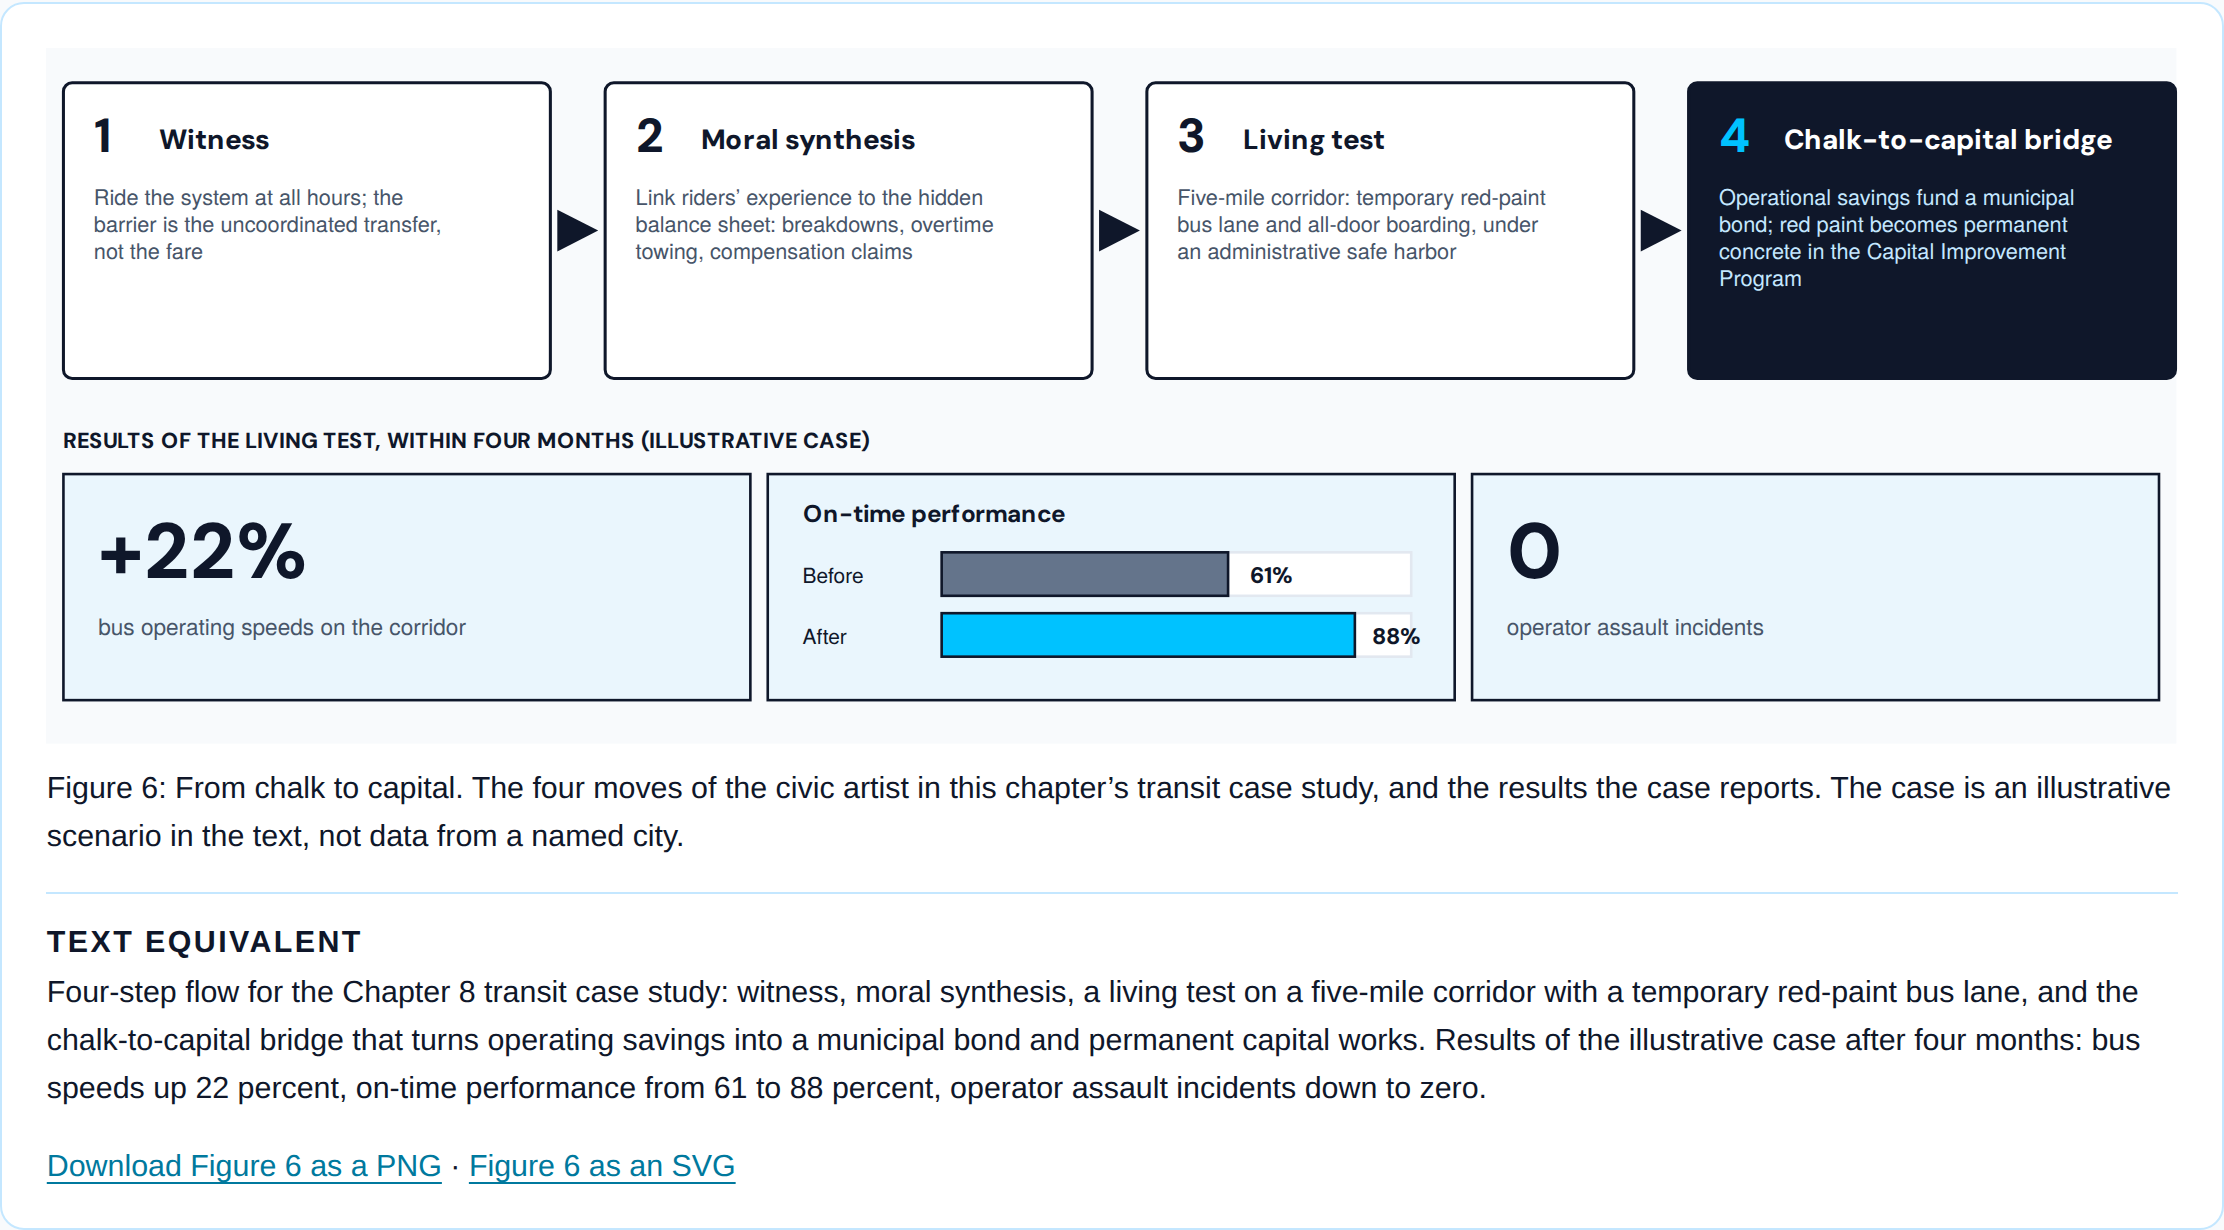
From chalk to capital: the transit case studyFour-step flow for the Chapter 8 transit case study: witness, moral synthesis, a living test on a five-mile corridor with a temporary red-paint bus lane, and the chalk-to-capital bridge that turns operating savings into a municipal bond and permanent capital works. Results of the illustrative case after four months: bus speeds up 22 percent, on-time performance from 61 to 88 percent, operator assault incidents down to zero.1WitnessRide the system at all hours; thebarrier is the uncoordinated transfer,not the fare2Moral synthesisLink riders’ experience to the hiddenbalance sheet: breakdowns, overtimetowing, compensation claims3Living testFive-mile corridor: temporary red-paintbus lane and all-door boarding, underan administrative safe harbor4Chalk-to-capital bridgeOperational savings fund a municipalbond; red paint becomes permanentconcrete in the Capital ImprovementProgramRESULTS OF THE LIVING TEST, WITHIN FOUR MONTHS (ILLUSTRATIVE CASE)+22%bus operating speeds on the corridorOn-time performanceBefore61%After88%0operator assault incidents
Figure 6: From chalk to capital. The four moves of the civic artist in this chapter’s transit case study, and the results the case reports. The case is an illustrative scenario in the text, not data from a named city.

Text equivalent

Four-step flow for the Chapter 8 transit case study: witness, moral synthesis, a living test on a five-mile corridor with a temporary red-paint bus lane, and the chalk-to-capital bridge that turns operating savings into a municipal bond and permanent capital works. Results of the illustrative case after four months: bus speeds up 22 percent, on-time performance from 61 to 88 percent, operator assault incidents down to zero.
Download Figure 6 as a PNG · Figure 6 as an SVG

More resources

The tools these figures serve: Tools. The whole book, free: The Book page. The remedy in brief: How to fix planning. The story behind it: How we got here.